Lessons Of 2017
Every year, the markets provide us with lessons on the prudent investment strategy. Many times, markets offer investors remedial courses, covering lessons it taught in previous years. That’s why one of my favorite sayings is that there’s nothing new in investing—only investment history you don’t yet know.
Last year supplied 10 important lessons. As you may note, many of them are repeats. Unfortunately, too many investors fail to learn them—they keep making the same errors again and again. We’ll begin with my personal favorite, one that the market, if measured properly, teaches each and every year.
Lesson 1: Active management is a loser’s game.
Despite an overwhelming amount of academic research demonstrating that passive investing is far more likely to allow you to achieve your most important financial goals, the vast majority of individual investor assets are still held in active funds. Unfortunately, investors in active funds continue to pay for the triumph of hope over wisdom and experience.
Last year was another in which the large majority of active funds underperformed, despite the great opportunity active managers had to generate alpha through the large dispersion in returns between 2017’s best-performing and worst-performing stocks. For example, while the S&P 500 returned 21.8% for the year, including dividends, in terms of price-only returns, 182 of the companies in the index were up more than 25%, 49 were up at least 50%, 10 were up at least 80.9%, and three more than doubled in value. The following table shows the 10 best returners:

To outperform, all an active manager had to do was to overweight those big winners. On the other hand, there were 125 stocks within the index that, on a price-only basis, were down for the year. Fifty-nine stocks lost at least 10%, 20 were down at least 25%, and the 10 largest losers (see the following table) lost at least 44.2%.

To outperform, all an active manager had to do was to underweight these dogs.
It’s important to note that this wide dispersion of returns is not at all unusual. Yet despite the opportunity, year after year, in aggregate, active managers persistently fail to outperform.
The following table shows the percentile rankings for funds from two leading providers of passively managed funds, Dimensional Fund Advisors and Vanguard, in 2017 and over the 15-year period ending December 2017. (Full disclosure: our firm recommends DFA funds in constructing client portfolios.)
Keep in mind that Morningstar’s data contains survivorship bias, as it only reflects funds that have survived the full period. The bias is significant, as about 7% of actively managed funds disappear every year, with their returns getting buried in the mutual fund graveyard. Thus, the longer the period, the worse the survivorship bias becomes, and at 15 years, it’s quite large.

Fraught With Opportunity
The results make it clear that active management is a strategy that can be said to be “fraught with opportunity.” Year after year, active managers come up with an excuse to explain why they failed, and then argue that next year will be different. Of course, it never is.
With that in mind, it’s interesting to note the following observation from Larry Fink, chief executive of BlackRock (which has more than $260 billion in assets under management).
The firm reportedly has been cutting back on active management and focusing instead on a more rules-based approach driven by algorithms rather than human intuition. Commenting on this change of strategy, Fink said this: “The democratisation of information has made it much harder for active management. We have to change the ecosystem—that means relying more on big data, artificial intelligence, factors and models within quant and traditional investment strategies.”
Mark Wiseman, hired in 2016 to revamp BlackRock’s equity business, added this: “The old way of people sitting in a room picking stocks, thinking they are smarter than the next guy—that does not work anymore.”
The good news is that lots of investors have figured this out. Over the three years ended Aug. 31, 2017, investors put nearly $1.3 trillion into passively managed mutual funds and ETFs while draining more than a quarter-trillion dollars from active funds, according to Morningstar. Although 66% of mutual fund and ETF assets are still actively invested, that number is down from 84% 10 years ago and shrinking fast. 2017 was the fourth-straight year that money had flowed into passive funds and out of active funds.
A good example of this trend is that, in April 2017, Pennsylvania’s elected treasurer revealed the state would move about $1 billion in funds that had been actively managed to passive strategies in an effort designed to save millions in annual fees.
Lesson 2: Valuations cannot be used to time markets.
We entered 2017 with U.S. equity valuations at very high levels. In particular, the popular metric known as the Shiller CAPE 10 was at 27.9—a level seen only twice before, in the late 1920s and the late 1990s, and both were followed by severe bear markets.
Cliff Asness’ 2012 study on the CAPE 10 found that when it was above 25.1, the real return over the following 10 years averaged just 0.5%—virtually the same as the long-term real return on the risk-free benchmark, one-month Treasury bills, and 6.3 percentage points below the U.S. market’s long-term real return. This concerned many investors, possibly leading them to reduce, or even eliminate, their equity holdings. However, it’s important to note there was still a wide dispersion of outcomes—the best 10-year forward real return was 6.3%, just half a percentage point below the historical average, while the worst was -6.1%.
In addition, what many investors may not have been aware of is that when using traditional price-to-earnings (P/E) ratios, history shows there is virtually no correlation between the market’s P/E and how the market performs over the subsequent year (or even years). The following is a good reminder of that.
In December 1996, the CAPE 10 was at virtually the same lofty level at which we began 2017 (that is, 27.7). The highly regarded—at least at the time—chairman of the board of the Federal Reserve, Alan Greenspan, gave a talk in which he famously declared the U.S. stock market to be “irrationally exuberant.” That speech, given in Tokyo, caused the Japanese market to drop about 3%, and markets around the globe followed. The next three years saw the S&P 500 Index return 33.4%, 28.6% and 21.0%, producing a compound return of 27.6%.
That higher valuations forecast lower future expected returns doesn’t mean one can use that information to time markets. And you should not try to do so, as the evidence shows such efforts are likely to fail.
This doesn’t mean, however, that the information has no value. You should use valuations to provide estimates of returns so you can determine how much equity risk you need to take in your portfolio to have a good chance of achieving your financial goals. But expected returns should only be treated as the mean of a potentially wide dispersion of outcomes. Your plan should be able to address any of these outcomes, good or bad.
Lesson 3: Even if the Fed is raising rates, it doesn’t mean you should stay in short-term bonds.
As we entered 2017, many investors were sure the Federal Reserve would continue to raise interest rates. That led many gurus to recommend investors limit their bond holdings to the shortest maturities. In late 2016, economist Jeremy Siegel even warned that bonds were “dangerous.”
On March 15, 2017, the Federal Reserve raised interest rates by 0.25 percentage points. It did so again on June 14, 2017, and once more on December 13, 2017.
However, despite the prediction that interest rates would rise having actually come to pass, the Vanguard Long-Term Treasury Index ETF (VGLT) returned 8.6%, outperforming Vanguard’s Intermediate-Term Treasury Index ETF (VGIT), which returned 1.7%, and the Vanguard Short-Term Treasury Index ETF (VGSH), which returned 0.0%.
The fact that rates are likely to rise doesn’t tell you anything about what bond maturity will produce the best return. The reason is quite simple. The markets are forward-looking—they incorporate all available information into current prices. With bonds, that means the yield curve already reflected the expectation of the Fed raising rates. Thus, unless rates rose even faster than expected, there would be no benefit to staying short as long as the yield curve was positively sloped, which it was throughout 2017.
Finally, the evidence shows there are no good forecasters when it comes to interest rates. We can see this each time S&P Dow Jones Indices produces its SPIVA scorecards. The following results are from the midyear 2017 scorecard, the latest available, and cover the 15-year period ending June 2017:
- Just 2% of actively managed long-term government bond funds, long-term investment-grade bond funds and high-yield funds beat their respective benchmarks.
- For domestic bond funds, the least poor performance was in intermediate- and short-term investment-grade funds, where 76% and 71% of active funds underperformed, respectively.
- Active municipal bond funds also fared poorly, with between 84% and 92% of them underperforming.
- Emerging market bond funds fared poorly as well, as 67% of them underperformed.
Lesson 4: Don’t make the mistake of recency. Last year’s winners are just as likely to be this year’s dogs.
The historical evidence demonstrates that individual investors are performance chasers—they buy yesterday’s winners (after the great performance) and sell yesterday’s losers (after the loss has already been incurred).
This causes investors to buy high and sell low—not exactly a recipe for investment success. This behavior explains the findings from studies that show investors can actually underperform the very mutual funds in which they invest.
Unfortunately, a good (poor) return in one year doesn’t predict a good (poor) return the next year. In fact, great returns lower future expected returns, and below-average returns raise future expected returns.
Thus, the prudent strategy for investors is to act like a postage stamp. The lowly postage stamp does only one thing, but it does it exceedingly well—it adheres to its letter until it reaches its destination. Similarly, investors should adhere to their investment plan (asset allocation). Sticking to one’s plan doesn’t mean just buying and holding. It means buying, holding and rebalancing—the process of restoring your portfolio’s asset allocation to your plan’s targeted levels.
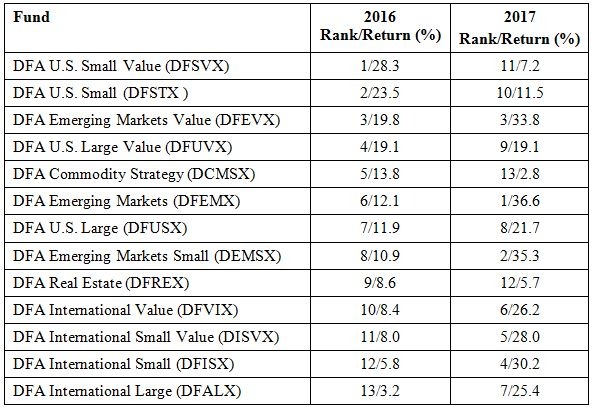
Using DFA’s passive mutual funds, the following table compares the returns of various asset classes in 2016 and 2017. As you can see, sometimes the winners and losers repeated, but other times they changed places.
For example, the best performer in 2016, U.S. small value, fell to 11th place in 2017; the sixth-best performer in 2016, emerging markets, rose to first place in 2017; and the 12th place performer in 2016, international small stocks, moved up to fourth place in 2017. (Full disclosure: we recommend DFA funds in constructing client portfolios.)
Lesson 5: Volatility can stay low for longer than expected.
While the VIX’s long-term average has been about 20, we entered 2017 with the volatility index well below that, at about 14. The historical evidence shows that volatility is negatively related to returns. The logical explanation is that volatility tends to spike when markets receive bad news, which tends to occur at unexpected times, when so-called black swans arrive. On the other hand, good news doesn’t tend to suddenly break out.
The VIX being well below historical levels led some gurus to believe investors were too complacent and overconfident, especially in light of very high U.S. stock valuations and a political environment that created a lot of uncertainty insofar as tax policy, health care and budget deficits. In addition, potential ill winds were blowing on the geopolitical front from Russia, North Korea, Iran and the Middle East in general.
Despite a dysfunctional political environment at home and these ill winds abroad, the VIX remained below 16 throughout the year. Evidence of last year’s low volatility can be found in the fact that there were only eight days in 2017 of 1% moves in the S&P 500 (four up and four down).
Looking back at the historical data, the year that had the lowest number of days with a 1% or greater move in the market was 1964, when there were three. In contrast, 2013 saw 134 such days. The record for days of a move of 1% or more was 199, which came in 1932. And with this low level of volatility, the market delivered strong returns.
Lesson 6: Ignore all forecasts because all crystal balls are cloudy.
One of my favorite sayings about the market forecasts of so-called experts is from Jason Zweig, financial columnist for The Wall Street Journal: “Whenever some analyst seems to know what he’s talking about, remember that pigs will fly before he’ll ever release a full list of his past forecasts, including the bloopers.”
You will almost never read or hear a review of how the latest forecast from some market “guru” actually worked out. The reason is that accountability would ruin the game—you would cease to “tune in.” But I believe forecasters should be held accountable. Thus, a favorite pastime of mine is keeping a collection of economic and market forecasts made by media-anointed gurus and then checking back periodically to see if they came to pass. This practice has taught me there are no expert economic and market forecasters.
Here’s a small sample from this year’s collection. I hope they teach investors a lesson about ignoring all forecasts, including the ones that happen to agree with their own notions (that’s the nefarious condition known as confirmation bias at work).
We’ll begin with the March 10, 2017 warning from David Rosenberg, chief economist and strategist at Gluskin Sheff & Associates as well as frequent guest on CNBC. The S&P 500 Index stood at 2,372. Rosenberg gave 10 reasons to be cautious about stocks as major indexes hovered near record highs:
- Stocks were expensive relative to their historical average.
- Margin debt stood at a record level.
- Private clients had “thrown in the towel,” plowing nearly $80 billion into equity funds since the November 2016 election—a classic sign of a market top is when “dumb money” chases gains.
- There was very narrow leadership.
- Investors were complacent with volatility at very low levels.
- The Fed would raise rates three times in 2017.
- Inflation would roar.
- Stocks were over-owned: 21.1% of household assets were in stocks, and he argued that “only five times in the past 156 years has the share been this high or higher—42% above the norm.”
- Credit markets were frothy (spreads were very narrow).
Such concerns are enough to scare many investors, and likely they did, especially those who shared them. However, the market ignored all those reasons, with the S&P 500 adding about another 13% for the year, not including dividends.
Others Agree
We turn now to the April 2017 warnings from some leading hedge fund managers. At a Goldman Sachs conference, billionaire and legendary hedge fund manager Paul Tudor Jones warned that years of low interest rates have bloated stock valuations (as measured by market cap to GDP) to a level not seen since 2000, right before the Nasdaq tumbled 75% over two-plus years.
Jones wasn’t alone among hedge fund managers who were warning investors. Guggenheim Partners’ Scott Minerd said he expected a “significant correction” in the summer or early fall. Philip Yang, a macro manager who has run Willowbridge Associates since 1988, saw a stock plunge of between 20% and 40%. Legendary value investor Seth Klarman, who runs the $30 billion Baupost Group, told investors in a letter that corporate insiders have been heavy sellers of their company shares. To him, that’s “a sign that those who know their companies the best believe valuations have become full or excessive.”
Warnings from four highly respected managers were likely enough to scare off many investors. Yet the markets ignored them all.
Shiller Weighs In
We next turn to a Sept. 21, 2017 column in which economist Robert Shiller warned investors about the risks of a bear market. He presented evidence that led him to conclude: “The US stock market today looks a lot like it did at the peaks before most of the country’s 13 previous bear markets.” Coming from a Nobel Prize-winner, that can be pretty scary.
Before going into his reasons for concern, note that Shiller was wise enough to add this caveat: “This is not to say that a bear market is guaranteed: such episodes are difficult to anticipate, and the next one may still be a long way off.” If you don’t provide the timing for an event you predict, it’s hard to say you are wrong. It’s easy to argue that it just hasn’t happened, yet.
Shiller began by noting that not only was the CAPE 10 above 30 (observing that it had been reached only twice before, and both times were followed by severe bear markets), but that while earnings growth was strong (from the second quarter of 2016 to the second quarter of 2017, real earnings growth was 13.2%, well above the 1.8% historical annual rate), it didn’t reduce the likelihood of a bear market.
He writes: “In fact, peak months before past bear markets also tended to show high real earnings growth: 13.3% per year, on average, for all 13 episodes. Moreover, at the market peak just before the biggest ever stock-market drop, in 1929-32, 12-month real earnings growth stood at 18.3%.”
Shiller also noted the “ostensibly good news that average stock-price volatility—measured by finding the standard deviation of monthly percentage changes in real stock prices for the preceding year—is an extremely low 1.2%. Between 1872 and 2017, volatility was nearly three times as high, at 3.5%. Yet again, this does not mean a bear market isn’t approaching. In fact, stock-price volatility was lower than average in the year leading up to the peak month preceding the 13 previous U.S. bear markets, though today’s level is lower than the 3.1% average for those periods. At the peak month for the stock market before the 1929 crash, volatility was only 2.8%.”
The U.S. stock market, as represented by the S&P 500, ignored Shiller’s warning, with the last quarter of 2017 providing a return of about 5.5%.
Contradictory Forecasts
Finally, we’ll look at two contradicting forecasts from former Goldman Sachs Group and Fortress Investment Group macro trader Michael Novogratz. On Dec. 23, 2017, he announced that he was shelving plans to start a cryptocurrency hedge fund. He predicted that bitcoin may extend its plunge to $8,000. Earlier in the same month, he predicted it could reach $40,000 within a few months. Which one should we have believed?
To be fair, there were surely some forecasts that turned out to be right. The problem comes in knowing ahead of time which ones to pay attention to, and which to ignore.
Here’s what Warren Buffett had to say about the value of forecasts in his 2013 letter to Berkshire Hathaway shareholders. “Forming macro opinions or listening to the macro or market predictions of others is a waste of time.”
He has also warned: “We have long felt that the only value of stock forecasters is to make fortune-tellers look good.” Unfortunately, one of the great ironies is that, while so many idolize Buffett, many of those same people not only ignore his advice, they tend to do exactly the opposite.
My long experience has taught me that investors tend to pay attention to the forecasts that agree with their preconceived ideas (again, that pesky confirmation bias) while ignoring forecasts that disagree. Being aware of our biases can help us overcome them.
Lesson 7: Sell in May and go away is the financial equivalent of astrology.
One of the more persistent investment myths is that the winning strategy is to sell stocks in May and wait to November to buy back into the market. While it’s true that, historically, stocks have provided greater returns from November through April than they have from May through October, since 1926, there’s still been an equity risk premium from May through October. From 1927 through 2016, the “Sell in May” strategy returned 8.4% per year, underperforming the S&P 500 by 1.6 percentage points per year. That’s even before considering any transaction costs, let alone the impact of taxes (you’d be converting what would otherwise be long-term capital gains into short-term capital gains, which are taxed at the same rate as ordinary income).
How did the sell-in-May-and-go-away strategy work in 2017? The S&P 500 Index’s total return for the period May through October was 9.1%. During this period, safe, liquid investments would have produced just 0.5%, providing virtually no return. In case you’re wondering, 2011 was the only year in the last nine when the sell in May strategy would have worked.
A basic tenet of finance is that there’s a positive relationship between risk and expected return. To believe that stocks should produce lower returns than Treasury bills from May through October, you would also have to believe stocks are less risky during those months—a nonsensical argument. Unfortunately, like with many myths, this one seems hard to kill off. And you can bet that next May the financial media will be resurrecting it once again.
Lesson 8: Hedge funds are not investment vehicles, they are compensation schemes.
This one has been appearing as regularly as the lesson that active management is a loser’s game. Hedge funds entered 2017 coming off their eighth-straight year of trailing U.S. stocks (as measured by the S&P 500 Index) by significant margins. And investors noticed.
In 2016, poor performance and withdrawals led to the closing of 1,057 hedge funds, the most since 2008. However, even after withdrawals of about $70 billion, that still left about 9,900 hedge funds (729 new hedge funds were started) managing just more than $3 trillion as we entered last year.
Unfortunately, the losing streak for hedge funds continued into a ninth year as the HFRX Global Hedge Fund Index returned just 6.0% in 2017, underperforming the S&P 500 Index by 15.8 percentage points. The following table shows the returns for various equity and fixed-income indexes.

As you can see, the HFRX Global Hedge Fund Index underperformed the S&P 500 and nine of the 10 major equity asset classes, but managed to outperform two of the three bond indexes.
An all-equity portfolio allocated 50% internationally and 50% domestically, equally weighted among the indexes within those broader categories, would have returned 21.3%, outperforming the hedge fund index by 15.3 percentage points. A 60% equity/40% bond portfolio with the same weighting methodology for the equity allocation would have returned 13.0% using one-year Treasuries, 13.4% using five-year Treasuries and 15.3% using long-term Treasuries.
Each of the three would have outperformed the hedge fund index. Given that hedge funds tout the freedom to move across asset classes as their big advantage, one would think that “advantage” would have shown up. The problem is that the efficiency of the market, as well as the cost of the effort, turns that supposed advantage into a handicap.
Over the long term, the evidence is even worse. For the 10-year period 2008 through 2017, the HFRX Global Hedge Fund Index returned -0.4% a year, underperforming every single equity and bond asset class. As you can see in the following table, underperformance ranged from 1.3 percentage points when compared to the Merrill Lynch One-Year Treasury Note Index to as much as 10.0 percentage points when compared to U.S small-cap stocks.

One Year Of Outperformance
Perhaps even more shocking is that, over this period, the only year the hedge fund index outperformed the S&P 500 was in 2008. Even worse, when compared to a balanced portfolio allocated 60% to the S&P 500 Index and 40% to the Barclays Government/Credit Bond Index, it underperformed every single year.
For the 10-year period, an all-equity portfolio allocated 50% internationally and 50% domestically, equally weighted within those broader categories, would have returned 6.2% per year. A 60% equity/40% bond portfolio, again with the same weighting methodology for the equity allocation, would have returned 4.8% per year using one-year Treasuries, 5.9% per year using five-year Treasuries and 7.6% per year using long-term Treasuries. All three dramatically outperformed the hedge fund index.
Finally, you may recall that a decade ago, in 2007, Warren Buffett bet $1 million that an index fund would outperform a collection of hedge funds over 10 years. He has now won that bet, with the big winner being a charity called Girls Inc. Over the course of the bet, his S&P 500 Index fund returned 7.1% per year versus just 2.2% per year for the basket of hedge funds selected by an asset manager at Protégé Partners.
The bottom line is that the evidence suggests investors are best served to think of hedge funds as compensation schemes, not investment vehicles.
Lesson 9: Don’t let your political views influence your investment decisions.
One of my more important roles as director of research at The BAM Alliance involves working to help prevent investors from committing what I refer to as portfolio suicide—panicked selling resulting from fear, whatever the source of that fear may be. The lesson to ignore your political views when making investment decisions is one that rears its head after every presidential election, and this time was no different. It seems to have become much more of an issue in 2017 because of the divisive views held by many about President Trump.
We often make mistakes because we are unaware that our decisions are being influenced by our beliefs and biases. The first step to eliminating, or at least minimizing, such mistakes is to become aware of how our choices are impacted by our views, and how those views can influence outcomes.
The 2012 study “Political Climate, Optimism, and Investment Decisions” showed that people’s optimism toward the financial markets and the economy is dynamically influenced by their political affiliation and the existing political climate. Among the authors’ findings were:
- Individuals become more optimistic and perceive the markets to be less risky and more undervalued when their preferred party is in power. This leads them to take on more risk, overweighting riskier stocks. They also trade less frequently. That’s a good thing, as the evidence demonstrates that the more individuals trade, the worse they tend to do.
- When the opposite party is in power, individuals’ perceived uncertainty levels increase and investors exhibit stronger behavioral biases, leading to poor investment decisions.
Now, imagine the nervous investor who sold equities based on views about a Trump presidency. While investors who stayed disciplined have benefited from the rally, those who panicked and sold not only have missed the bull market, but now face the incredibly difficult task of figuring out when it will be once again safe to invest.
Similarly, I know of many investors with Republican leanings who were underinvested once President Obama was elected. And now it’s Democrats who have to face their fears. The December 2016 Spectrem Affluent Investor and Millionaire Confidence surveys provided evidence of how political biases can impact investment decisions.
Prior to the 2016 election, with a victory for Hillary Clinton expected, those identified as Democrats showed higher confidence than those who identified as Republicans or Independents. This completely flipped after the election. Those identified as Democrats registered a confidence reading of -10, while Republicans and Independents showed confidence readings of +9 and +15, respectively.
What’s important to understand is that if you lose confidence and sell, there’s never a green flag that will tell you when it’s safe to get back in. Thus, the strategy most likely to allow you to achieve your goals is to have a plan that anticipates there will be problems, and to not take more risk than you have the ability, willingness and need to assume. Additionally, don’t pay attention to the news if doing so will cause your political beliefs to influence your investment decisions.
Lesson 10: Just because something hasn’t happened doesn’t mean it won’t.
As we entered 2017, with U.S. stock valuations at historically very high levels, many investors were waiting for a market decline before they would buy equities again. Giving them confidence there would be a bear market (a drop of 20% or more), a “correction” (a drop of 10% or more) or at least a dip was that the S&P 500 had never gone a full year in which there wasn’t at least one month with a negative return. The only year that came close was 1995, which saw a drop of just 0.4% in October.
As it turned out, 2017 set a record, with every month showing a gain, extending the index’s record-setting winning streak to 14 months. This provides a good example of why I consider it a rule of prudent investing to never treat the unlikely as impossible or the likely as certain. In case you’re interested, or are one of those investors waiting for that dip, 1995 was followed by another strong year, with the S&P 500 up 23%.
Investors would do well to remember this advice from Peter Lynch: “Far more money has been lost by investors in preparing for corrections, or anticipating corrections, than has been lost in the corrections themselves.”
Summary
2018 will surely offer investors more lessons, many of which will be remedial courses. And the market will provide you with opportunities to make investment mistakes. You can avoid making errors by knowing your financial history and having a well-thought-out plan.
Larry Swedroe is the Director of Research for The BAM Alliance.
This commentary originally appeared January 19 on ETF.com
By clicking on any of the links above, you acknowledge that they are solely for your convenience, and do not necessarily imply any affiliations, sponsorships, endorsements or representations whatsoever by us regarding third-party Web sites. We are not responsible for the content, availability or privacy policies of these sites, and shall not be responsible or liable for any information, opinions, advice, products or services available on or through them.
The opinions expressed by featured authors are their own and may not accurately reflect those of Beacon Hill Private Wealth and the BAM Alliance. This article is for general information only and is not intended to serve as specific financial, accounting or tax advice.
© 2018, The BAM ALLIANCE