The Battle of the Passive Strategies
My first book, The Only Guide to a Winning Investment Strategy You’ll Ever Need, was first published 20 years ago, in May 1998. With its 20th anniversary in mind, let’s see how my recommendations worked out for investors who followed them.
The book had two main themes. The first was that, while markets were not perfectly efficient, they were sufficiently efficient to make active management a loser’s game. While the game was possible to win, the odds of doing so were so low that, even before taxes, it was not prudent to try. That led to my recommendation to avoid actively managed funds. Instead, I suggested investors use passively managed funds, such as index funds and other structured portfolios, that eschew both individual security selection and market timing.
If the battle between active and passive strategies were a prizefight, the judges would have long ago declared a TKO. Year after year, the S&P Dow Jones Indices SPIVA scorecards show that, no matter the asset class, the majority of actively managed stock and bond funds underperform their benchmark indices – and the longer the investment horizon, the greater the failure rate. That’s even before considering taxes, which are often actively managed funds’ largest expense. Several recent studies, including Eugene Fama and Kenneth French’s "Luck Versus Skill in the Cross-Section of Mutual Fund Returns," have found similar results; today, only about 2% of actively managed funds are generating statistically significant alpha. That’s down from about 20% 20 years ago. Again, that’s before taxes.
Using passive strategies was clearly the winning strategy and, thus, was the right recommendation.
The second theme was based on research, specifically, Fama and French’s “The Cross-Section of Expected Stock Returns,” showing that, in addition to market beta, equities had two other unique sources of risk and expected return: size and value. Not only did small and value stocks have higher expected returns, but, as unique sources of risk that added incremental explanatory power to the cross-section of equity returns, they also provided diversification benefits. Thus, my recommendation was for investors to consider “tilting” (that is, having more than the market’s exposure) their portfolios to small and value stocks both domestically and internationally. This was a very different strategy than the total stock market approach recommended by John Bogle (the father of index investing). Thus, this dichotomy is the “battle of passive strategies.”
The following table shows the results investors could have earned using both strategies. The data covers the 20-year period from May 1998 through April 2018. It shows the annualized returns, volatility and Sharpe ratio for Vanguard’s three total market funds (U.S., international and emerging markets) and the structured asset class portfolios from Dimensional Fund Advisors (Dimensional). (Full disclosure: My firm recommends DFA funds in constructing client portfolios.)
The data is based on the returns of live funds, not back-tested index (paper) portfolios. Thus, it includes not only the fund’s expense ratio, but also all implementation costs. Despite the higher expense ratios and higher turnover, in each case Dimensional’s small and value funds not only provided higher returns than Vanguard’s lower-expense total-market funds, but they also provided higher Sharpe ratios (a measure of risk-adjusted returns).
In the U.S., the outperformance ranged from 1.2% per year for large value to as much as 2.6% for small value. In developed markets, the outperformance ranged from at least 1.6% per year for large value to as much as 3.4% for small value. Finally, in emerging markets, the outperformance ranged from 3.4% per year for large value to 4.1% for small stocks and 5.0% for small value. Despite the higher volatility associated with these riskier assets, in each case Dimensional’s funds earned higher Sharpe ratios. While investors should have expected the higher returns, they shouldn’t have expected the higher Sharpe ratios; if you believe markets are efficient, then you should also believe all risky assets ought to provide similar Sharpe ratios.

The book provided a third test of passive strategies. Specifically, I explained that while index funds are the superior strategy to actively managed funds, most index funds (other than total-market funds) have weaknesses that can be minimized or eliminated through intelligent design and patient trading (including the use of algorithmic trading programs). In addition, structured asset-class funds, such as those offered by Dimensional, can provide greater exposure to the factors investors are trying to access. Thus, while they have higher expenses, investors should not solely care about cost. Instead, they should focus on higher expected return (which may be achieved by lowering the cost per unit of factor exposure). As a result, while both Dimensional’s structured asset class funds and Vanguard’s index funds are on our investment policy committee’s list of approved funds, Dimensional’s funds have been our preferred recommended vehicles. (We also include some of the funds from AQR and Bridgeway Capital Management.) Both of these fund families’ funds appear in the book’s appendix listing recommending funds that investors should consider when implementing their asset allocation plan.
Unfortunately, because Vanguard did not have international-small and value index funds over the full period, our test is limited to U.S. funds. Because the first full month of results for the Vanguard small-value index fund was not until June 1998, for that asset class the test is one month short of the full 20 years.

In the asset class of U.S. large-value stocks, the Dimensional fund provided a 1.7% higher return and produced a 0.05 higher Sharpe ratio. In the asset class of U.S. small stocks, the Dimensional small-cap fund provided a 0.5% higher return and a slightly higher (0.01) Sharpe ratio. The Dimensional micro-cap fund provided an even higher return, outperforming by 1%, while also producing a slightly higher (0.02) Sharpe ratio.
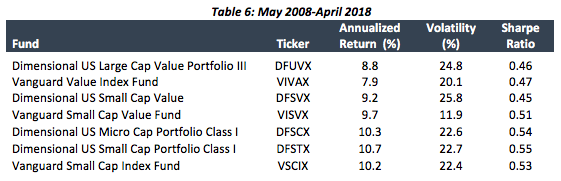
The following table shows the results for the U.S. small-value funds.

In the asset class of U.S. small-value stocks, the Dimensional fund provided a 0.9% higher return while also producing a slightly higher (0.02) Sharpe ratio.
Again, the higher returns of the Dimensional funds should have been expected, because they provided more exposure to the size and value factors and to their associated premiums (the stocks they own, on average, have smaller market capitalizations and lower prices relative to such metrics as earnings and book value). However, the higher Sharpe ratios were a pleasant surprise.
Given the uncertain future inherent in investing, the evidence from the 20-year live test (not a back-test) demonstrate that my book’s recommendations, as well as the recommendation to stay the course and avoid market timing, served investors well.
Postscript
Much has been written about the “disappearance” of the size and value premiums over the last 10 years. Before reviewing the actual results of the last 10 years of the 20-year period we just examined, keep in mind that historical evidence demonstrates that all factors, including market beta, experience long periods, perhaps even 20 years and longer, of negative premiums. The following table uses data from Ken French’s website to provide evidence on the persistence of factor premiums. The data covers the period from 1927 through 2017. As you can see, 14% of 10-year periods saw the value premium produce negative returns. That isn’t much different from the 9% of the time that the market beta premium was negative over 10-year periods. In other words, long periods of negative premiums are not unusual, though they do test the patience and discipline of investors.

The next table recreates Table 1. However, the period is now the last 10 years of the 20-year period ending April 2018. It examines the returns of Dimensional’s structured asset-class funds relative to Vanguard’s total market funds.

In the U.S., the value funds from Dimensional underperformed the Vanguard total-market fund, though the underperformance was minor – 0.5% for large value and just 0.1% for small value. However, their Sharpe ratios underperformed by relatively greater amounts (.09 and 0.1). On the other hand, Dimensional’s micro-cap fund outperformed by 1% and its small-cap fund outperformed by 1.4%. The Sharpe ratios were, however, virtually identical to that of the market.
In international markets, the performance of size and value was superior, producing not only higher returns in each case, but also higher Sharpe ratios. In emerging markets, Dimensional’s value fund provided a 0.4% higher return and a 0.02 higher Sharpe ratio; its small-cap fund provided a 4.2% higher return and a 0.13 higher Sharpe ratio. In developed international markets, the results were similar. Dimensional’s large value fund provided a 0.1% higher return and a 0.01 higher Sharpe ratio; its small-cap and small-cap value funds provided a 3.7% higher return and 0.15 higher Sharpe ratios.
Thus, while the last 10 years was a period of relatively poor performance, historically, for the size and value premiums, overall investors generally were still rewarded with higher returns than a total-market cap-weighted index fund.
The final table recreates the comparisons from Tables 2 and 3 over last 10 years of the 20-year period, comparing the returns of Dimensional’s structured portfolios to those of Vanguard’s similar index funds.
In the asset class of U.S. large-value stocks, Dimensional’s fund provided a 0.9% higher return, though its Sharpe ratio was slightly lower (0.1). In the case of U.S. small-value funds, the Vanguard fund provided a 0.5% higher return while also producing a 0.06 higher Sharpe ratio. In the asset class of small stocks, both of the Dimensional funds provided higher returns (0.1% in the case of the micro-cap fund and 0.5% in the case of the small-cap fund) and slightly higher Sharpe ratios (0.01 and 0.02, respectively).
The evidence shows that, even over one of the worst 10-year periods, historically, for the size and value factors, investors were not penalized in the form of lower returns for the belief that over the long term they would be rewarded for taking the greater risks of small and value stocks.
Larry Swedroe is the director of research for The BAM Alliance.
This commentary originally appeared June 18 on AdvisorPerspectives.com.
This material and any opinions contained are derived from sources believed to be reliable, but its accuracy and the opinions based thereon are not guaranteed. The content of this publication is for general information only and is not intended to serve as specific financial, accounting or tax advice. By clicking on any of the links above, you acknowledge that they are solely for your convenience, and do not necessarily imply any affiliations, sponsorships, endorsements or representations whatsoever by us regarding third-party Web sites. We are not responsible for the content, availability or privacy policies of these sites, and shall not be responsible or liable for any information, opinions, advice, products or services available on or through them. The opinions expressed by the author are their own and may not accurately reflect those of Beacon Hill Private Wealth LLC. This article is for general information only and is not intended to serve as specific financial, accounting or tax advice.
Past performance is no guarantee of future results. There is no guarantee investment strategies will be successful. Investing involves risks including possible loss of principal. Investors should talk to their financial advisor prior to making any investment decision. There is always the risk that an investor may lose money. A long-term investment approach cannot guarantee a profit.
© 2018, The BAM Alliance