
Investing Lessons From 2018
Every year, the markets provide us with lessons on the prudent investment strategy. Many times, markets offer investors remedial courses, covering lessons it taught in previous years. That’s why one of my favorite sayings is that “there’s nothing new in investing, only investment history you don’t yet know.”
2018 supplied 11 important lessons. As you may note, many of them are repeats from prior years. Unfortunately, too many investors fail to learn them—they keep making the same errors. We’ll begin with my personal favorite, one that the market, if measured properly, teaches each and every year.
Lesson 1: Active management is a loser’s game.
Despite an overwhelming amount of academic research demonstrating that passive investing is far more likely to allow you to achieve your most important financial goals, the vast majority of individual investor assets are still held in active funds. And unfortunately, investors in active funds continue to pay for the triumph of hope over wisdom and experience.
Last year was another in which the large majority of active funds underperformed despite the fact that the industry claims active managers outperform in bear markets. In addition to their advantage of being able to go to cash, active managers had a great opportunity to generate alpha through the large dispersion in returns between 2018’s best- and worst-performing stocks.
For example, while the S&P 500 Index lost 4.4% for the year, including dividends, in terms of price-only returns, the stocks of 10 companies in it were up at least 42.6%. The following table, with data from S&P Dow Jones Indices, shows the 10 best returners.

To outperform, all an active manager had to do was to overweight those big winners, each of which outperformed the index by at least 47%. On the other hand, 10 stocks lost at least 49%, with the worst performer losing 67% on a price-only basis.

To outperform, all an active manager had to do was to underweight, let alone avoid, these dogs.
It’s important to note that this wide dispersion of returns is not at all unusual. Yet despite the opportunity, year after year, in aggregate, active managers persistently fail to outperform. The following table shows the Morningstar percentile rankings for funds from two leading providers of passively managed funds, Dimensional Fund Advisors and Vanguard, in 2018 and over the 15-year period ending December 2018. (Full disclosure: My firm recommends Dimensional funds in constructing client portfolios.)

Keep in mind that Morningstar’s data contains survivorship bias, as it only reflects funds that have survived the full period. The bias is significant, as about 7% of actively managed funds disappear every year, with their returns getting buried in the mutual fund graveyard. Thus, the longer the period, the worse the survivorship bias becomes, and at 15 years, it’s quite large.
For example, performing the same analysis at the end of 2016, I found that, while the average Vanguard fund had a 15-year Morningstar ranking of 36 and the average Dimensional fund had a ranking of 16, once I accounted for the survivorship bias, Vanguard’s ranking improved to 21 and Dimensional’s to 10. For taxable investors, the data is even more compelling, because taxes are typically the highest cost of active management. Thus, the survivorship-bias-free, after-tax rankings for Vanguard’s and Dimensional’s funds would be significantly better.
The results make it clear active management is a strategy that can be said to be “fraught with opportunity.” Year after year, active managers come up with an excuse to explain why they failed, and then argue that next year will be different. Of course, it never is.
Lesson 2: Diversification is always working; sometimes you like the results, and sometimes you don’t.
Everyone is familiar with the benefits of diversification. It’s been called the only free lunch in investing because, done properly, diversification reduces risk without reducing expected returns. However, once you diversify beyond a popular index, such as the S&P 500, you must accept the fact that, almost certainly, you will be faced with periods, even long ones, when a popular benchmark index, reported by the media on a daily basis, outperforms your portfolio. The noise of the media will then test your ability to adhere to your strategy.
Of course, no one ever complains when their diversified portfolio outperforms the popular benchmark—experiences positive tracking error. The only time you hear complaints is when the diversified portfolio underperforms—experiences negative tracking error.
As the table below demonstrates, 2018 was just such a year. To show the returns of various equity asset classes, I used Dimensional’s asset class funds. Returns data is from Dimensional. (Again, in the interest of full disclosure, my firm recommends Dimensional funds in constructing client portfolios.)
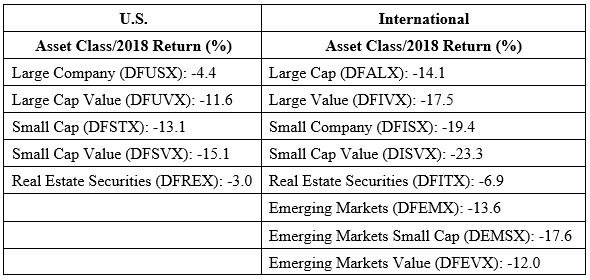
In some ways, 2018 was similar to 1998 in that U.S. stocks outperformed international stocks, and large and growth stocks outperformed small and value stocks. What’s important to understand is that we should want to see a wide dispersion of returns. If we didn’t, when one asset class performed poorly, we could expect them all to perform poorly, and to similar degrees.
Wide dispersions of returns also provide us with opportunities to rebalance the portfolio, buying the underperformers at relatively lower prices, at a time when their expected returns are now higher, and selling the outperformers at relatively higher prices, at a time when their expected returns are now lower. Of course, that requires discipline, which is a skill that most investors don’t possess. The table below demonstrates the importance of adhering to your plan.

Lesson 3: Don’t make the mistake of recency. Last year’s winners are just as likely to be this year’s dogs.
The historical evidence demonstrates that individual investors are performance chasers—they buy yesterday’s winners (after the great performance) and sell yesterday’s losers (after the loss has already been incurred). This causes investors to buy high and sell low—not exactly a recipe for investment success. This behavior explains the findings from studies that show investors can actually underperform the very mutual funds in which they invest.
For example, in a July 2005 study published in “Morningstar FundInvestor,” Morningstar found that in all 17 fund categories it examined, the returns earned by investors were below the returns of the funds themselves. Unfortunately, a good (poor) return in one year doesn’t predict a good (poor) return the next year. In fact, great returns lower future expected returns, and below-average returns raise future expected returns.
Thus, the prudent strategy for an investor is to act like a postage stamp. The lowly postage stamp does only one thing, but it does it exceedingly well—it adheres to its envelope until it reaches its destination. Similarly, investors should adhere to their investment plan (asset allocation). Sticking to one’s plan doesn’t mean just buying and holding. It means buying, holding and rebalancing—the process of restoring your portfolio’s asset allocation to your plan’s targeted levels.
Using Dimensional’s structured mutual funds, the following table compares the returns of various asset classes in 2017 and 2018. As you can see, sometimes the winners and losers repeated, but other times they changed places.
For example, the best performer in 2017, emerging markets, fell to 6th place in 2018; and the worst performer in 2017, U.S. real estate securities rose to first place in 2018. Returns data is from Dimensional. (Once more, in full disclosure, my firm recommends Dimensional funds in constructing client portfolios.)

Lesson 4: Volatility doesn’t stay low forever. Your discipline will be tested.
While the VIX’s long-term average has been about 20, we entered 2018 with the Volatility Index well below that, at about 11. In addition, it had mostly remained below its historical average for the prior six years, a period of strong equity returns—as the historical evidence shows that volatility is negatively related to returns.
The logical explanation is that volatility tends to spike when markets receive bad news, which tends to occur at unexpected times, when so-called black swans arrive. On the other hand, good news doesn’t tend to suddenly break out.
In terms of daily volatility, 2018 was the most volatile since 2011, according to data from S&P Dow Jones Indices. In 2018 (2011), the S&P 500 Index saw a price change of at least 2% 38 (68) times, 3% 16 (24) times, 4% five (10) times and 5% one (five) time(s).
After hitting a high of 36 on Dec. 24, the VIX closed at 25.42, well above its historical average. Once again, the increase in volatility was accompanied by poor equity returns. This served as a needed reminder that equities are risky, and investors should never become complacent. They should anticipate periods of poor returns, building them into their plans, as history teaches us that large losses are not that unusual. For example, from 1948 through 2017, the Dow Jones industrial average fell at least 15% about once every three years. It also fell by 20% or more about once every six years.
The historical evidence demonstrates that today’s 35-year old investor needs to plan on having to live through only about 10 more bear markets over his or her lifetime, and 20 more periods of losses of at least 15%. Experience has taught me that the only way you are likely to be a successful investor, surviving those periods, is to have a well-thought-out plan that anticipates these events. Forewarned is forearmed.
Lesson 5: The stock market and the economy are two very different things.
It was the best of times, it was the worst of times. The U.S. economy continued to grow at a strong pace throughout the year, with second-quarter GDP growing 4.2%, third-quarter growing 3.4% and fourth-quarter growth expected to come in at 2.6%.
On the other hand, Christmas Eve saw the S&P 500 come very close to closing in bear market territory, putting the index down 19.8% from its Sept. 20 closing high of 2930.75. Clearly, the market and the economy were on divergent paths. What may surprise investors is that this is not unusual.
As Ben Carson pointed out in his October 2018 column, the S&P 500 has had 20 bear markets (down 20% or worse) and 27 corrections (down 10% but less than 20%) since 1928. The average losses saw stocks fall 24% and last 228 days from peak-to-trough. Carson noted that, of those 47 double-digit sell-offs, 31 occurred outside of a recession and didn’t happen in the lead-up to a recession—about two-thirds of the time, the market experienced a double-digit drawdown with no recession as the main cause. Of those 31 that occurred outside of a recession, the losses were -18% over 154 days, on average. This also demonstrates that the stock market is not a good indicator of a recession (Carson cited the old joke that the market has predicted nine of the last five recessions). In other words, there is nothing unusual about the recent performance of the market.
Carson also showed that, on average, the S&P 500 has been up 1% in the three months prior to the start of the 14 recessions since the one that began in August 1929. For those investors worried that the market’s recent drop foretells bad economic news, which might tempt them to abandon their plan and sell equities, the evidence should convince them that this is not likely to prove to be a good strategy.
Lesson 6: Ignore all forecasts, because all crystal balls are cloudy.
One of my favorite sayings about the market forecasts of so-called experts is from Jason Zweig, financial columnist for The Wall Street Journal: “Whenever some analyst seems to know what he’s talking about, remember that pigs will fly before he’ll ever release a full list of his past forecasts, including the bloopers.”
You will almost never read or hear a review of how the latest forecast from some market “guru” actually worked out. The reason is that accountability would ruin the game—you would cease to “tune in.” But I believe forecasters should be held accountable. Thus, a favorite pastime of mine is keeping a collection of economic and market forecasts made by media-anointed gurus and then checking back periodically to see if they came to pass. This practice has taught me there are no expert economic and market forecasters.
Here’s a small sample from this year’s collection. I hope they teach investors a lesson about ignoring all forecasts, including the ones that happen to agree with their own notions (that’s the nefarious condition known as “confirmation bias” at work). Note, I collect mainly the ones calling for really bad things to happen—with history demonstrating that far fewer bad things happen than are predicted by gurus.
We’ll examine four predictions, beginning with the Jan. 4, 2018 forecast by legendary investor and billionaire hedge fund manager Ray Dalio of Bridgewater Associates. He warned that the bond market had slipped into a bear phase and that a rise in yields could spark the biggest crisis for fixed-income investors in almost 40 years. There was no bear market in bonds in 2018, with even Vanguard’s Long-Term Treasury Index ETF (VGLT) losing just -1.5%, while the Vanguard Intermediate-Term Treasury Index ETF (VGIT) returned 1.4% and the Vanguard Short-Term Treasury Index ETF (VGSH) returned 1.6%. Strike 1.
Dalio added: “The Federal Reserve will tighten monetary policy faster than they have signaled.” The Fed did tighten four times, as expected. Strike 2. He also stated: “It feels stupid to own cash in this kind of environment. It’s going to be great for earnings and great for stimulation of growth.” While he was right about corporate earnings and economic growth, cash turned out to be about the best investment in 2018. Strike 3.
That Dalio was right about corporate earnings and economic growth, yet so wrong about his market forecasts for both stocks and bonds, demonstrates how difficult it is for forecasters to get it right. That is why Buffett’s advice is to ignore all forecasters because their forecasts tell you more about them than they do about the market.
Next up is the June 1, 2018 prediction by “Bond King” Bill Gross. Gross forecasted that the Federal Reserve’s expected rate hike in June would be its last for the year. On June 13, the Fed raised its target for the federal funds rate to between 1.75% and 2%. However, that was not to be the last increase. In fact, there were two more. It raised rates at its September meeting to a range of 2-2.25%, and then again at its December meeting, ending the year with the target between 2.25% and 2.5%.
Our third forecast is the July 26, 2018 prediction by David Rosenberg, chief market strategist of Gluskin Sheff in Toronto, who predicted that the day’s GDP report was infested with “fake data.” While he acknowledged that the second-quarter GDP report would be strong (the final second-quarter growth rate was 4.2%), Rosenberg believed it would be the last good quarter in the cycle, as the Fed's quantitative tightening would kick in just as the stimulus from tax cuts wound down.
Rosenberg was clearly wrong on his economic forecast, as economic growth continued strong despite the continued tightening by the Fed and the tariffs imposed during the trade war. Third-quarter GNP growth came in at 3.4%, and the Philadelphia Federal Reserve’s Fourth Quarter Survey of Professional Forecasters calls for fourth-quarter growth of 2.6%.
It’s also worth pointing out that in March, Rosenberg predicted we would have a 20% stock market correction (we got to 19.8% for the S&P 500 on Dec. 24). However, that was based on his outlook for an economy heading into a recession within the next 12 months (he has three more months to get that one right, though it seems highly unlikely with the Philly Fed’s latest forecast calling for first-quarter GNP growth of 2.4%. The fact that Rosenberg was wrong on his economic outlook but accurate in his call for a bear market shows how difficult a task it is to forecast the stock market. It’s just one of the reasons active management is the loser’s game.
Finally, given the cryptocurrency mania that had infected many investors, no review of forecasts would be complete without one on bitcoin. In an interview with the Motley Fool in November 2017, David Drake, founder of LDJ Capital, asserted that bitcoin would hit $20,000 in 2018. “There’s a fixed supply of it, but growing demand,” he said. “When that happens, the price rises.” Bitcoin closed the year at about $3,700.
To be fair, some forecasts turned out right. For example, at the end of July, Morgan Stanley warned that a correction worse than February’s was looming. The problem comes in knowing ahead of time which forecasts to pay attention to, and which to ignore. Long experience has taught me that investors tend to pay attention to the forecasts that agree with their preconceived ideas (that pesky confirmation bias) while ignoring forecasts that disagree. Being aware of our biases (including political ones) can help us overcome them.
Lesson 7: “Sell in May and go away” is the financial equivalent of astrology.
One of the more persistent investment myths is that the winning strategy is to sell stocks in May and wait to buy back into the market until November. Let’s look at the historical evidence. Using Ken French’s data library, since 1926, it is true that stocks have provided greater returns from November through April than they have from May through October. That may be the source of the myth. The average premium of the S&P 500 Index over one-month Treasury bills averaged 8.4 percentage points per year over the entire period. And the average premium of the portfolio from November through April was 5.7% compared to just 2.5% for the May through October portfolio.
In other words, the equity risk premium from November through April has been more than twice the premium from May through October. Furthermore, the premium was negative more frequently for the May-through-October portfolio, with 34% of the six-month periods having a negative result compared to 27% of the six-month periods for the November-through-April portfolio.
From 1926 through 2017, the S&P 500 Index returned 10.2% per year. Importantly, the May-through-October portfolio had a positive equity risk premium of 2.5% per year, which means the portfolio still outperformed Treasury bills on average. In fact, a strategy that invested in the S&P 500 Index from November through April, and then invested in riskless one-month Treasury bills from May through October, would have returned 8.3% per year from 1926 to 2017, underperforming the S&P 500 Index by 1.9 percentage points per annum. That’s even before considering any transactions costs, let alone the impact of taxes (you’d be converting what would otherwise be long-term capital gains into short-term capital gains, which are taxed at the same rate as ordinary income).
Let’s see how the strategy performed in 2018. Even though October was a rough month for equities, with the S&P 500 Index losing 6.8%, the S&P 500 Index returned 3.4% from May through October, outperforming riskless one-month Treasury bills (which returned 0.9%) by 2.5 percentage points.
What’s perhaps most interesting is that the last year the “sell in May” portfolio outperformed the consistently invested portfolio was 2011. Yet you can be sure that, come next May, the financial media will be raising the myth once again.
A basic tenet of finance is that there’s a positive relationship between risk and expected return. To believe that stocks should produce lower returns than Treasury bills from May through October, you would also have to believe stocks are less risky during those months—a nonsensical argument. Unfortunately, as with many myths, this one seems hard to kill.
Lesson 8: Inflation wasn’t, and isn’t, inevitable.
One of the most persistently asked questions I’ve received since 2009 is some version of the following: “What should I do about the inevitable rampant inflation problem we’re going to face because of the huge fiscal and monetary stimulus that’s been injected into the economy?” While that risk has existed, the fact is, since 2008, we haven’t had a single year in which the CPI exceeded 3%. In fact, 2011 is the only year it exceeded 2.5%.
A related myth persists among many investors as well. I frequently hear concerns about the exploding growth rate of our nation’s money supply. This belief likely has been fueled by certain commercials—the ones that recommend buying gold because central banks are printing money like we’re experiencing Weimar Germany all over again.
The fact is that M2, a broad measure of the money supply, hasn’t been growing at rates that suggest rampant inflation should be expected. For the 10-year period from Dec. 8, 2008 through Dec. 7, 2018, the Federal Reserve Bank of St. Louis reports that the rate of growth in M2 was 5.9%.
Since, as Milton Friedman, one of our greatest economists, noted, “inflation is always and everywhere a monetary phenomenon,” the factual data doesn’t support the view that we should have expected rampant inflation. In fact, despite the fears of many investors who seem certain that we will see massive inflation, neither the bond market nor professional economists are expecting anything of the kind.
We can at least get an estimate of the market’s forecast for inflation by looking at the difference between the year-end 2.68% yield on 10-year nominal bonds and the roughly 0.97% yield on 10-year Treasury inflation-protected securities, or TIPS. The difference is just 1.71 percentage points.
Clearly, investors, in aggregate, don’t appear concerned about rampant inflation. As for economists’ expectations, the Federal Reserve Bank of Philadelphia’s Fourth Quarter 2018 Survey of Professional Forecasters has a 10-year forecast of inflation averaging just 2.2% at an annual rate. Again, they don’t believe rampant inflation is likely, let alone inevitable.
Don’t get the wrong idea—the risk that inflation could increase dramatically is still present. It hasn’t happened so far because, even though the monetary base has been increasing rapidly (as the Fed’s balance sheet expanded through its bond-buying program), the velocity of money (as measured by M2) has fallen pretty persistently from about 2.0 at the end of 2007 to about 1.5 at the end of 2018, a drop of approximately 25%.
That said, there remains the risk that if or when the velocity of money begins to rise, inflation could increase. Of course, the Fed is well aware of this risk and would likely act—reverse its bond-buying program and raise interest rates—to prevent inflation from taking off.
Lesson 9: They are called “risk premiums” for a reason.
Many investors have been bemoaning the fact that the value premium—the excess return of value stocks relative to growth stocks—seems to have disappeared, turning negative for the past 10 years in the U.S. (although value has outperformed growth in international markets).
The trouble with this line of thinking, however, is that stock returns are extremely noisy from a statistical perspective. Thus, even a time frame as long as 10 years isn’t long enough to make a definitive statement about any strategy that invests in an asset class or investment factor.
For example, consider the 10-year period from 2000 through 2009, when the S&P 500 Index returned -0.9% a year and underperformed riskless one-month Treasury bills by 3.7 percentage points a year.
Even over the longer 13-year period 2000 through 2012, they underperformed, with the S&P 500 returning 1.7% and one-month Treasury bills returning 2.1%. The S&P 500 also underperformed one-month bills over the 15-year period ending in 1943, and over the 14-year period ending in 1982. Hopefully, such long periods wouldn’t prove long enough to convince you that stocks shouldn’t be expected to outperform Treasury bills. Or consider the even longer 40-year period from 1969 through 2008, when the U.S. total stock market returned 8.8% and underperformed the 8.9% return of long-term U.S. Treasuries.
Consider also the performance of international and emerging market stocks, which have underperformed over the most recent 10-year period. For the period 2009 through 2018, and using data from Portfolio Visualizer, the Vanguard Total Stock Market ETF (VTI)returned 13.3% per year, outperforming both the Vanguard FTSE Developed Markets ETF (VEA) and the Vanguard FTSE Emerging Markets ETF (VWO), which returned 6.1% per year and 7.5% per year, respectively.
Many investors will look at such performance and conclude that investing internationally is a bad idea. After all, 10 years is a long time to them. However, we get an entirely different view if we move back in time and look at the performance of the prior seven years, from 2002 through 2008.
During this period, and again using data from Portfolio Visualizer, the Vanguard 500 Index (VFIAX) lost 1.6%, underperforming the Vanguard Developed Markets Index (VTMGX), which returned 4.0%, by 5.6 percentage points a year, and the Vanguard Emerging Markets Index (VEIEX), which returned 10.9%, by 12.5 percentage points a year. An investor making decisions at the start of 2009 based on the prior seven years of performance would have made a very poor choice.
Unfortunately, far too many investors put too great an emphasis on recent short-term performance when considering investment decisions. The media tends to exacerbate the problem as opposed to helping investors stick to a disciplined strategy.
Chasing past performance can cause investors to buy asset classes after periods of strong recent performance, when valuations are relatively higher and expected returns are lower. Alternatively, it can lead investors to sell asset classes after periods of weak recent performance, when valuations are relatively lower and expected returns are higher.
In fact, investors who chase recent performance are systematically buying high and selling low. A better approach is to follow a disciplined rebalancing strategy that systematically sells what has performed relatively well recently and buys what has performed relatively poorly recently.
When evaluating your asset allocation, recent performance should not be a factor in the decision. Smart investors know that all investment strategies that entail risk-taking will have bad years, or even many bad years in a row. That’s the nature of risk. After all, if this weren’t the case, there wouldn’t be any risk. With that knowledge, smart investors know that recency is their enemy, and patience and discipline (accompanied by rebalancing) are their friends.
Lesson 10: The world isn’t flat, and the diversification of risky assets is as important as ever.
The financial crisis of 2008 caused the correlations of all risky assets to rise toward 1. This led many in the financial media to report on the “death of diversification”—because the world is now flat (interconnected); diversification no longer works. This theme has been heard repeatedly since 2008.
Yet diversification benefits come not just from correlations but the dispersion of returns as well. And wide dispersion of returns in almost every year since 2000 demonstrates there are still large diversification benefits.

Note that there were only three years of the 19 when the difference in returns between the S&P 500 Index and the MSCI EAFE Index was less than 5%. On the other hand, there were 10 years when it was at least 8%. There were also only three years when the return on the S&P 500 Index was within 10% of the return on the MSCI Emerging Markets Index. There were seven years when it was at least 20% and three when it was at least 30%. The largest gap was more than 53%.
The data presents pretty powerful evidence both that the investment world is far from flat and that there are still significant benefits in international diversification.
Lesson 11: The road to riches isn’t paved with dividends.
Despite the fact that traditional financial theory has long held that dividend policy should be irrelevant to stock returns, over the last 10 years, we’ve seen a dramatic increase in investors’ interest in dividend-paying stocks. This heightened attention has been fueled both by hype in the media and the current regime of interest rates, which are still well below historical averages.
The low yields available on safe bonds have led even once-conservative investors to shift their allocations from such fixed-income investments into dividend-paying stocks. This is especially true for those who take an income, or cash flow, approach to investing (as opposed to a total return approach, which I believe is the right one).
How did that strategy work in 2018? According to data from S&P Dow Jones Indices, the 415 dividend-paying stocks within the S&P 500 Index (equal-weighting them) lost 8.1%, underperforming the 92 nondividend payers, which returned -2.4%, an outperformance of 5.7 percentage points.
In addition, Vanguard’s High-Dividend ETF (VYM) lost 5.9%. It has also underperformed the S&P 500 in six of the last seven years (the exception was 2016). And over the last 10 years, VYM returned 12.2% per year, underperforming VFIAX (Vanguard 500 Index Fund) which returned 13.1%.
Summary
Even smart people make mistakes. What differentiates them from fools is that they don’t repeat them, expecting different outcomes. 2019 will surely offer you more lessons, many of which will be remedial courses. And the market will provide you with opportunities to make investment mistakes.
You can avoid making errors by knowing your financial history and having a well-thought-out plan. Consider including in your new year’s resolutions that you will learn from the lessons the market teaches.
Larry Swedroe is the director of research for The BAM Alliance.
This commentary originally appeared January 21, 2019 on EFT.com. View 2017 and 2016 lessons.
This material and any opinions contained are derived from sources believed to be reliable, but its accuracy and the opinions based thereon are not guaranteed. The content of this publication is for general information only and is not intended to serve as specific financial, accounting or tax advice. By clicking on any of the links above, you acknowledge that they are solely for your convenience, and do not necessarily imply any affiliations, sponsorships, endorsements or representations whatsoever by us regarding third-party Web sites. We are not responsible for the content, availability or privacy policies of these sites, and shall not be responsible or liable for any information, opinions, advice, products or services available on or through them. The opinions expressed by the author are their own and may not accurately reflect those of Beacon Hill Private Wealth LLC. This article is for general information only and is not intended to serve as specific financial, accounting or tax advice.
Past performance is no guarantee of future results. There is no guarantee investment strategies will be successful. Investing involves risks including possible loss of principal. Investors should talk to their financial advisor prior to making any investment decision. There is always the risk that an investor may lose money. A long-term investment approach cannot guarantee a profit.